FISHERY
CHALLENGES
CONTEXT
The use of drifting FADs by tropical purse seiners dates from the early 1990s, and it was first motivated by the high success rate of FAD sets compared to sets made on free schools. Since then, their use has considerably increased thanks to the development of new technologies that equip FADs with GPS and echo sounders.
FADs increase the catchability of tuna and other associated species, essentially acting as fishing traps. In addition to the overfishing of juvenile bigeye and yellowfin tuna, the massive use of FADs is questioned due to the increased capture of vulnerable shark species.
FADs increase the catchability of tuna and other associated species, essentially acting as fishing traps. In addition to the overfishing of juvenile bigeye and yellowfin tuna, the massive use of FADs is questioned due to the increased capture of vulnerable shark species.
FAD management is therefore a major challenge to ensure the sustainable use of tuna resources and other associated species, as well as the conservation of vulnerable species.

OBSTACLES
Depending on the different fishing areas, according to their richness in target tuna species by size and abundance of vulnerable associated species, what number of operational FADs would be optimal to ensure a sustainable exploitation without risk for tuna, sharks, and other bycatch species?
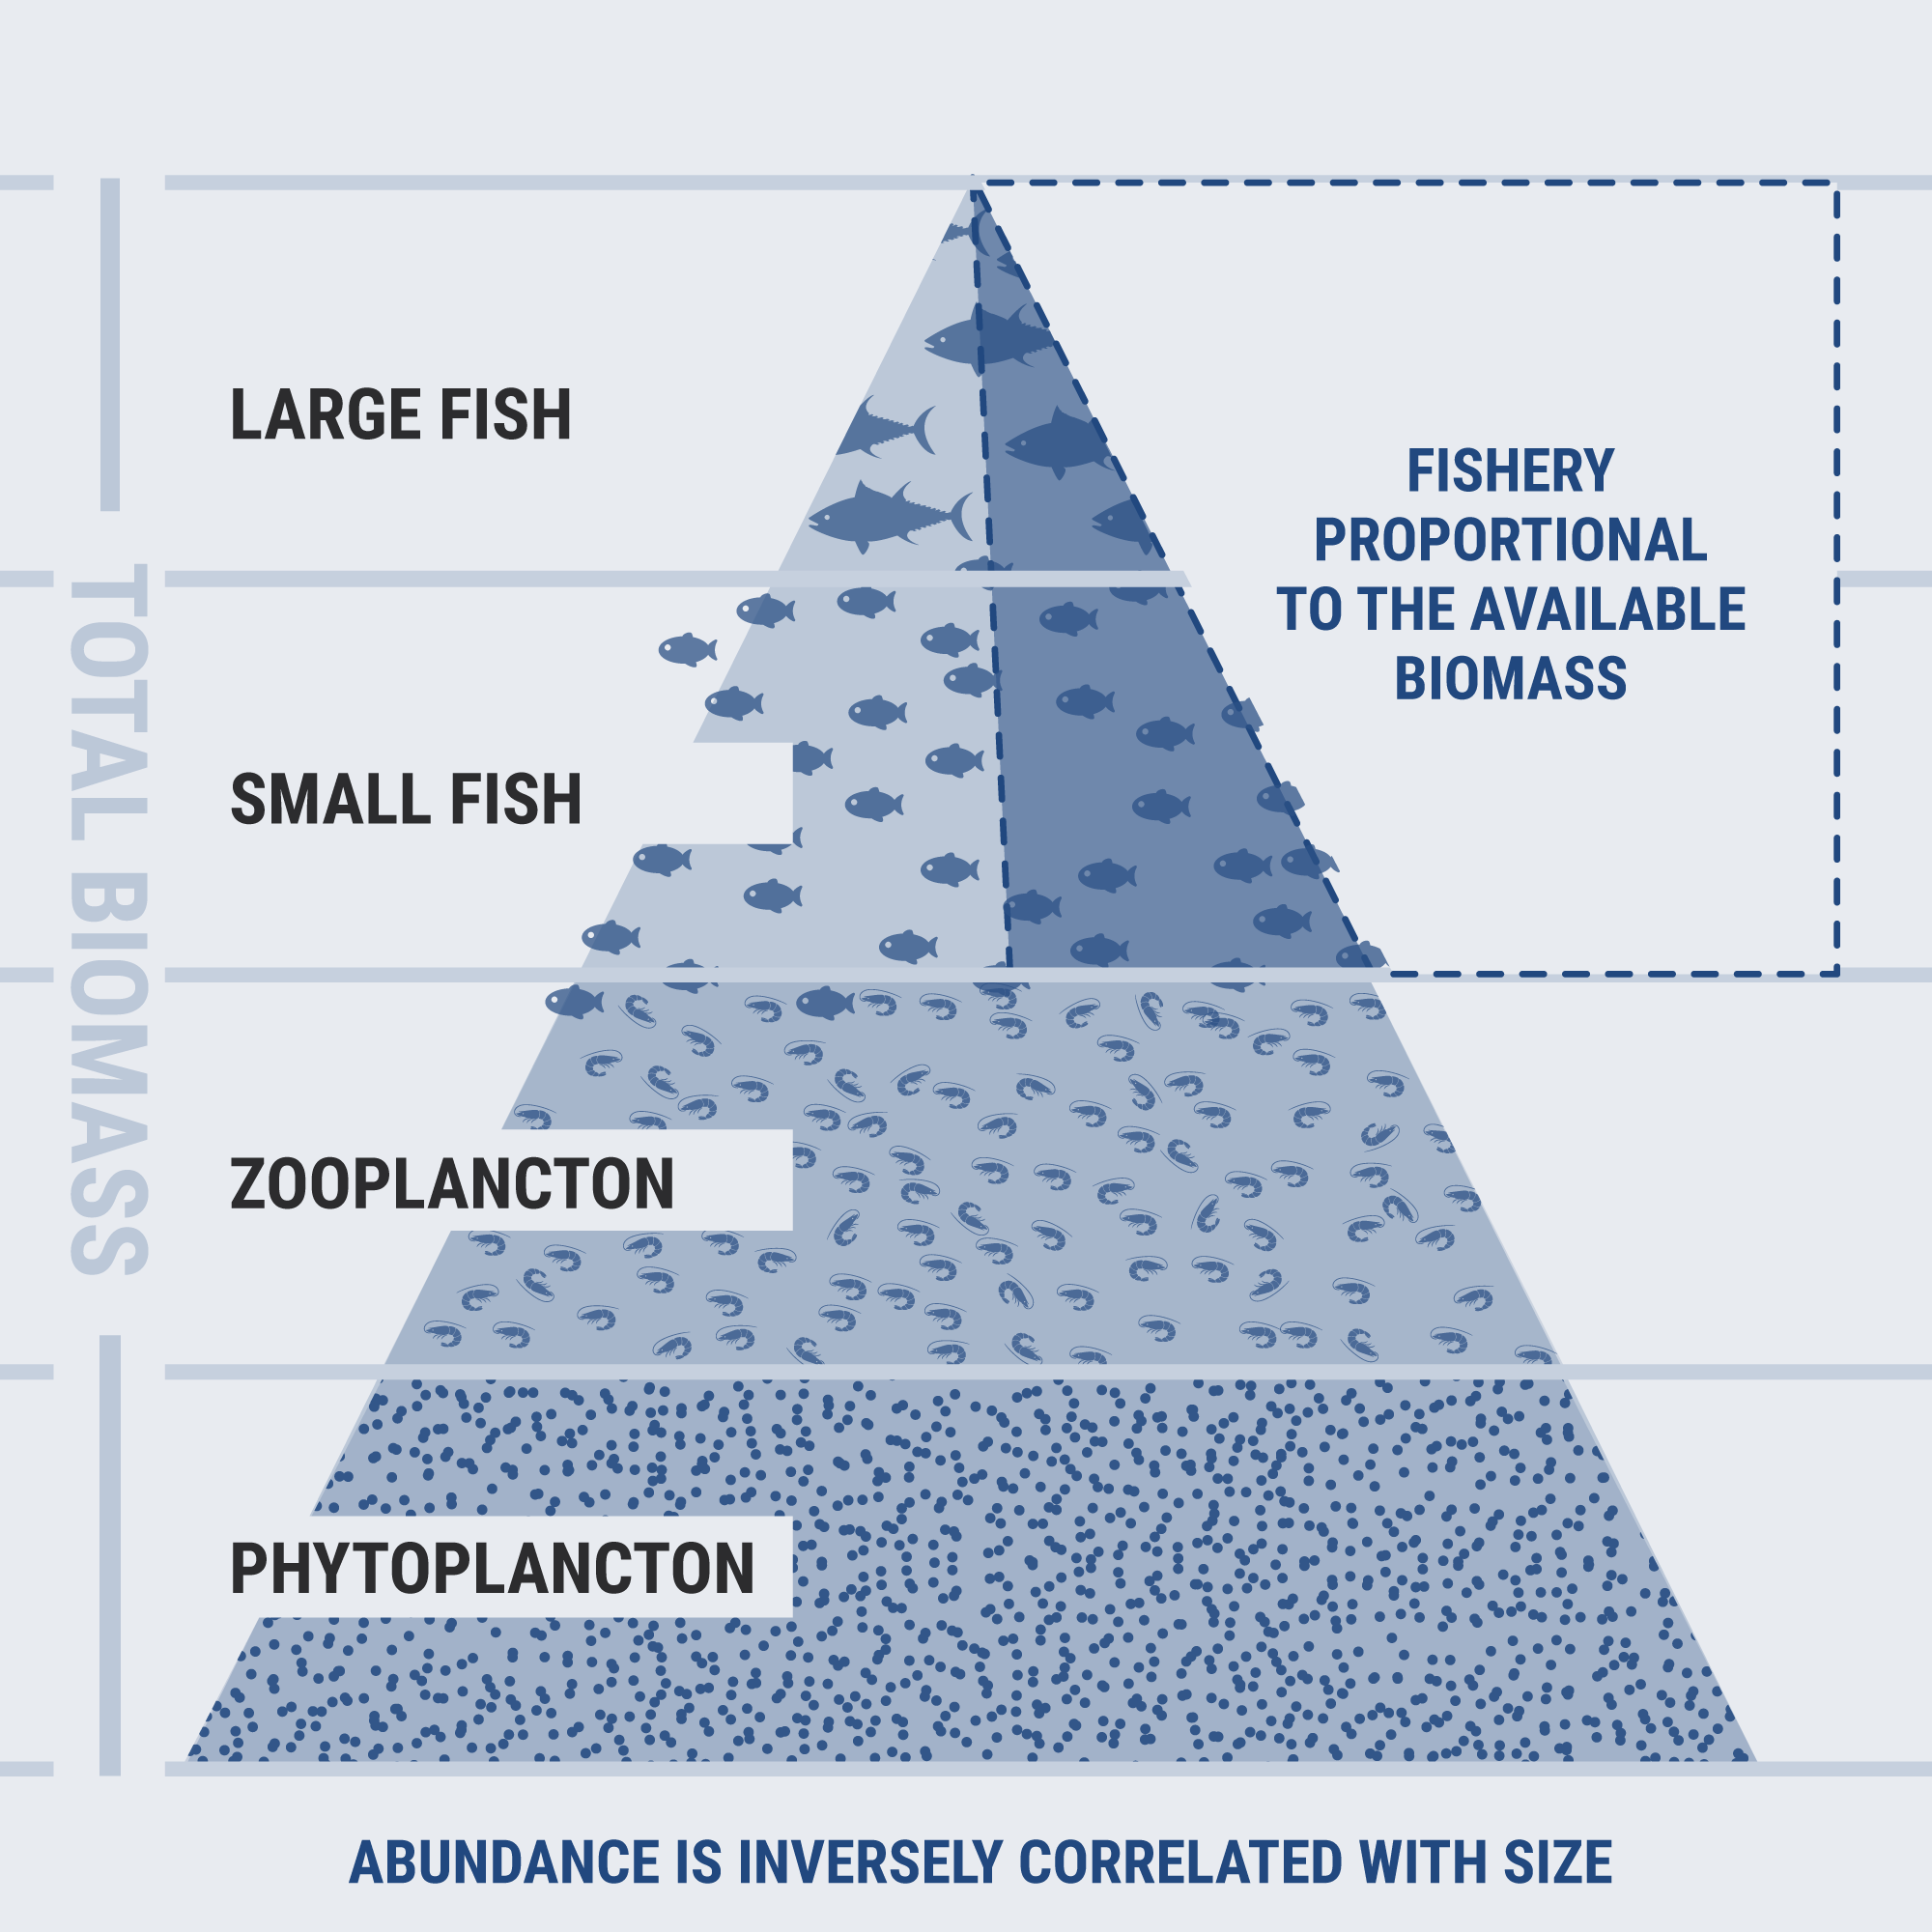
Fisheries management is not yet conducted within an ecosystem approach, considering the diversity of exploited species by size and/or ecological niche.
Considering all the species and sizes of fish exploited by tuna purse seiners, as well as by other fishing gears, what exploitation patterns (catch by species and by size), including all fisheries, would conserve the theoretical structure of the ecosystem?
ACTIONS
A comparison of the yields of tropical tunas and vulnerable associated species will be made by vessel and by major spatio-temporal strata according with control indicators related to FADs. These indicators include the total number of FADs deployed per month, the daily number of operational FADs (i.e., tracked, activated and in the water), the number vessel-owned FAD sets or total FAD sets (including vessel-owned, foreign FADs and natural objects). Modelling the relationship between the control indicators and associated catches will provide a range of optimal values for each spatio-temporal stratum.
In parallel, FAD catches, in terms of volume and size by tuna species and by spatio-temporal strata, will be compared to the overall purse seine catches in free schools and to other fishing gear targeting tropical tuna.
Finally, the size distribution of catches for all species and fishing gears, will be compared to the theoretical size distribution of the ecosystem. In the event of a discrepancy, adjustments between fishing gears can be studied to better balance this distribution, so that it is more respectful of the theoretical structure of the ecosystem.
